If you are not planning to shell out heavy subscription fees to dedicated Market Profile charting platforms, here is a free alternative that you can meanwhile make use of.
On the Tradingview Platform, there is a free to use indicator that draws the market profile value area, point control, etc. All the important variables of the Market Profile chart reading can be plotted for free in Realtime, free of cost using this indicator.
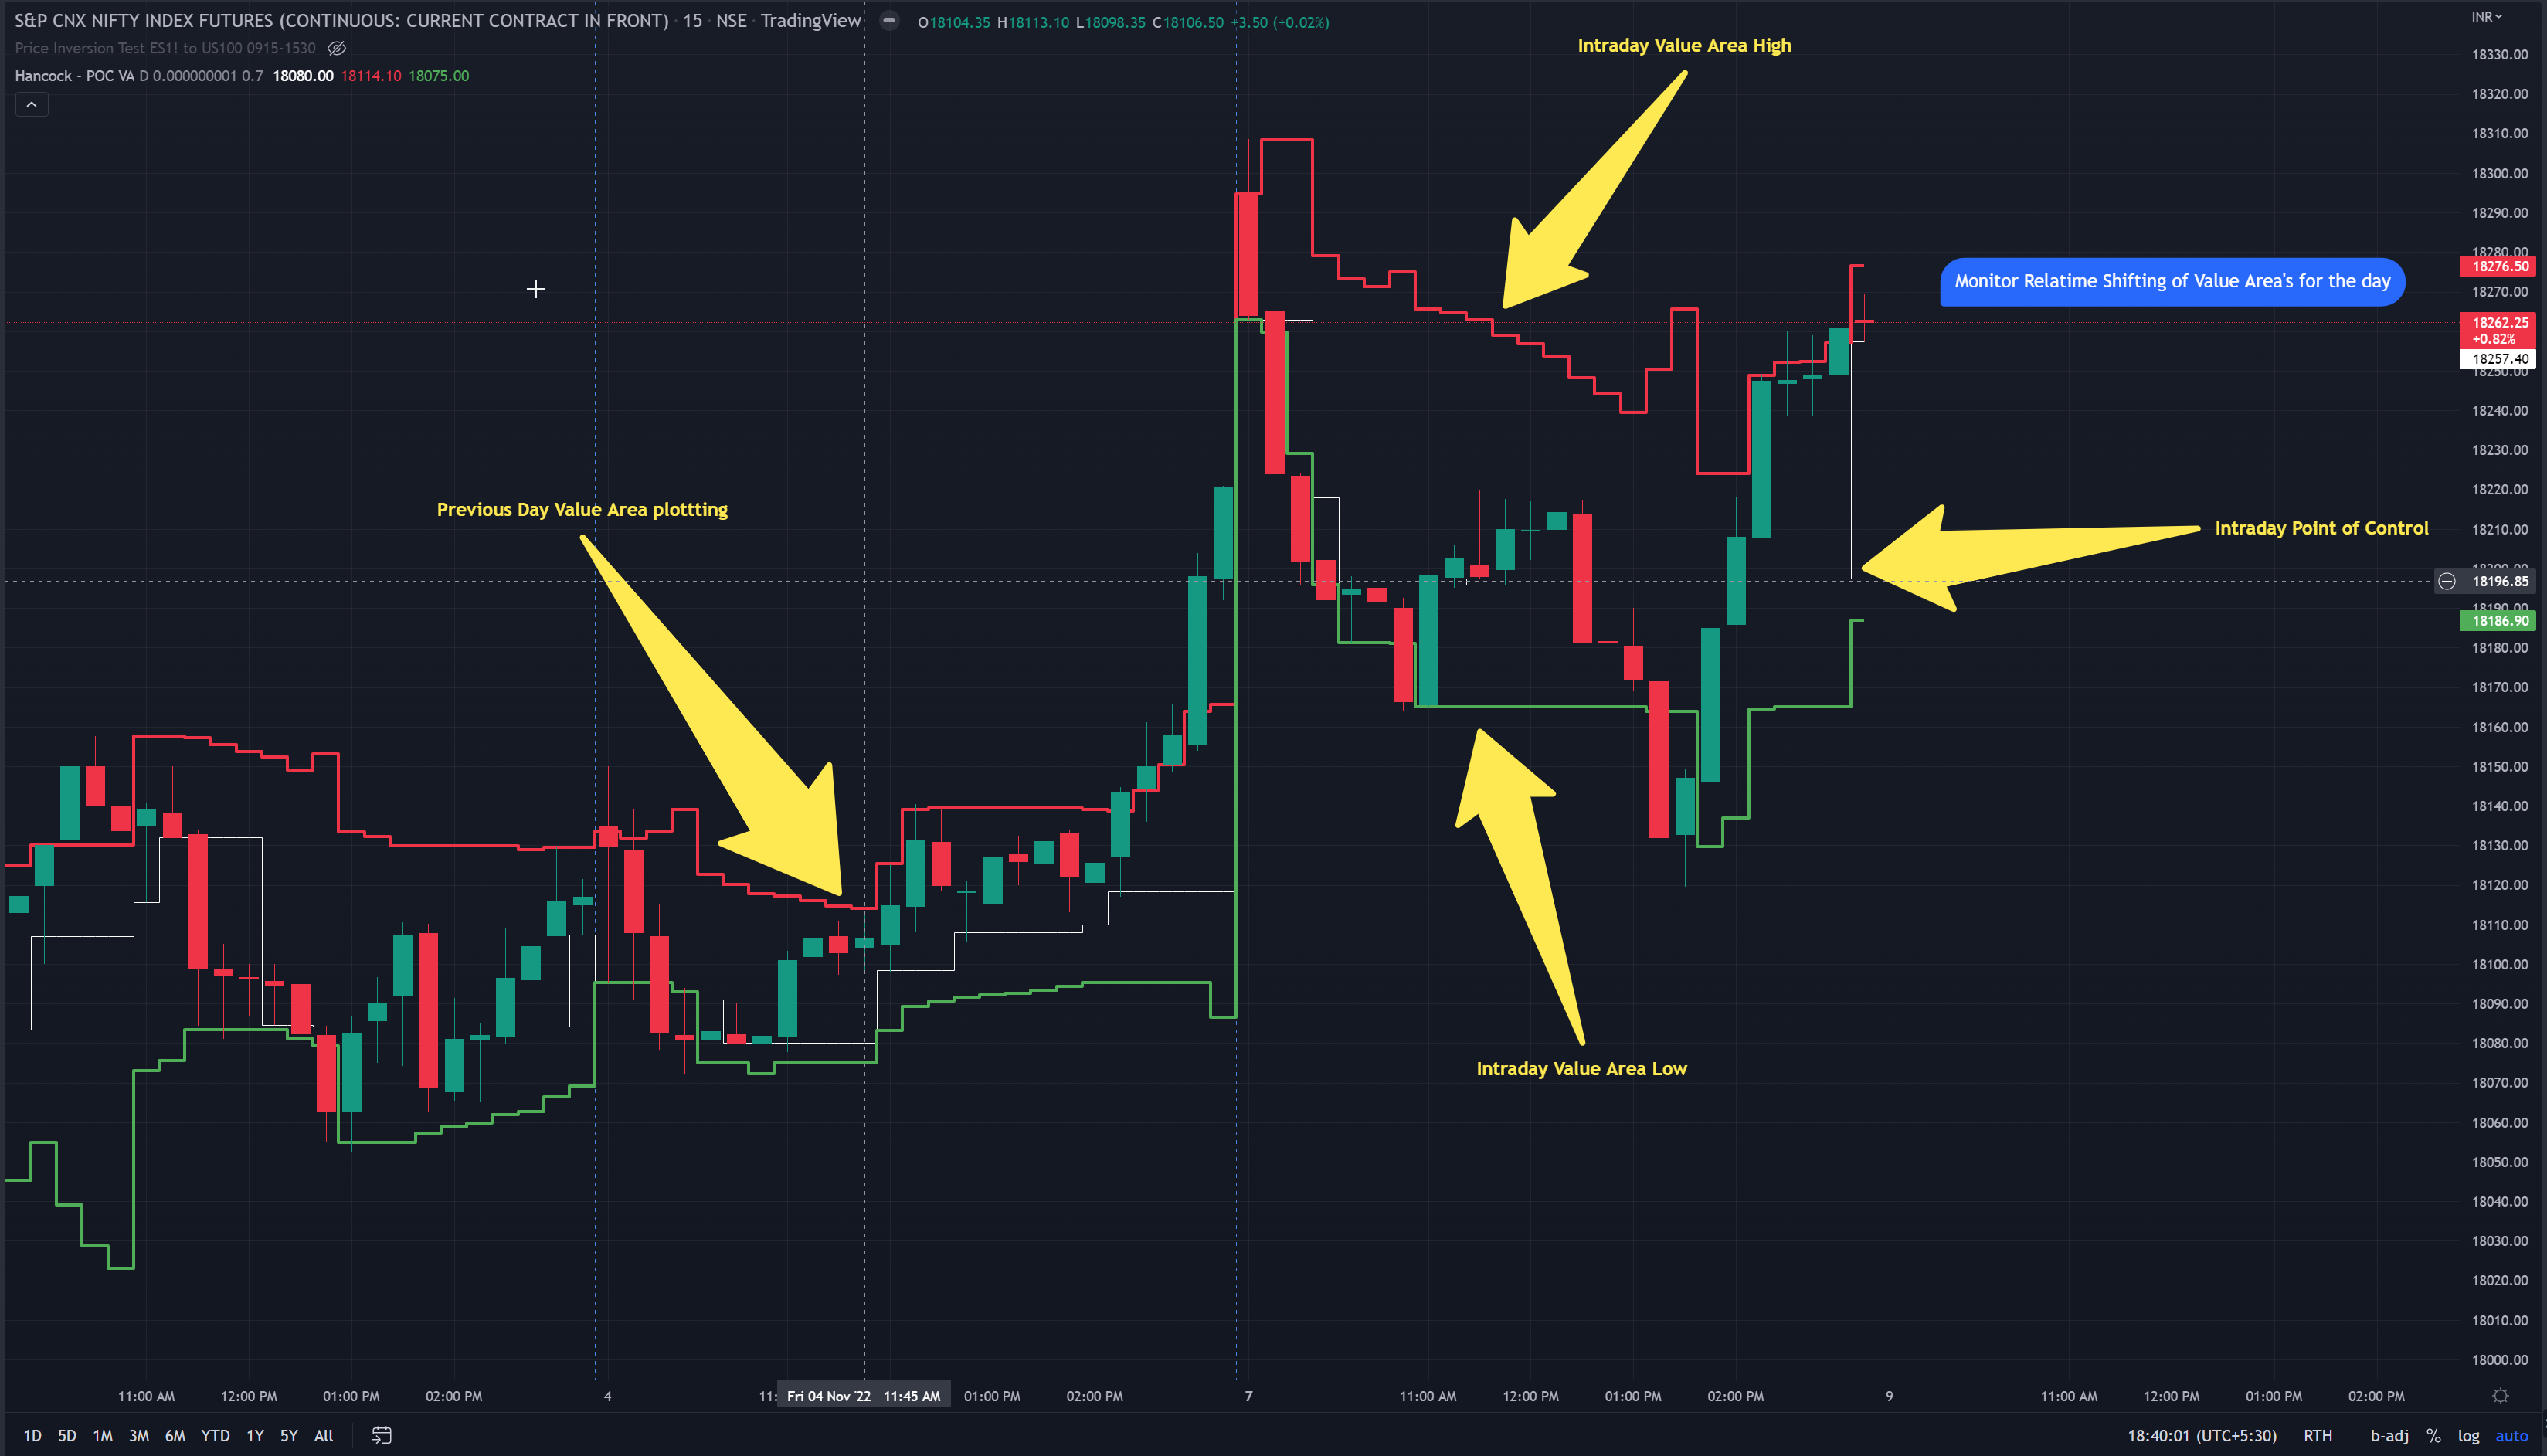
The added advantage of using this free indicator is that you can watch the Point of Control & value area shift during intraday. On this indicator, you can visually assess if the POC for the day is moving to a higher or lower area during the day.
The indicator name is Hancock – POC VA and is available for free on the TradingView indicator library .
The indicator works with instruments has a volume variable. So, for example, if you want to plot it on an instrument that has no volume variable (like an index instrument), use the indicator on the underlying futures instrument instead.
This free indicator on tradingview plots the following Market Profile Chart reading variables in Realtime
- Current Day Point of Control.
- Current Day Value Area High.
- Current Day Value Area Low.
- Previous Day’s POC
- Previous Day’s VAH
- Previous Day’s VAL, etc
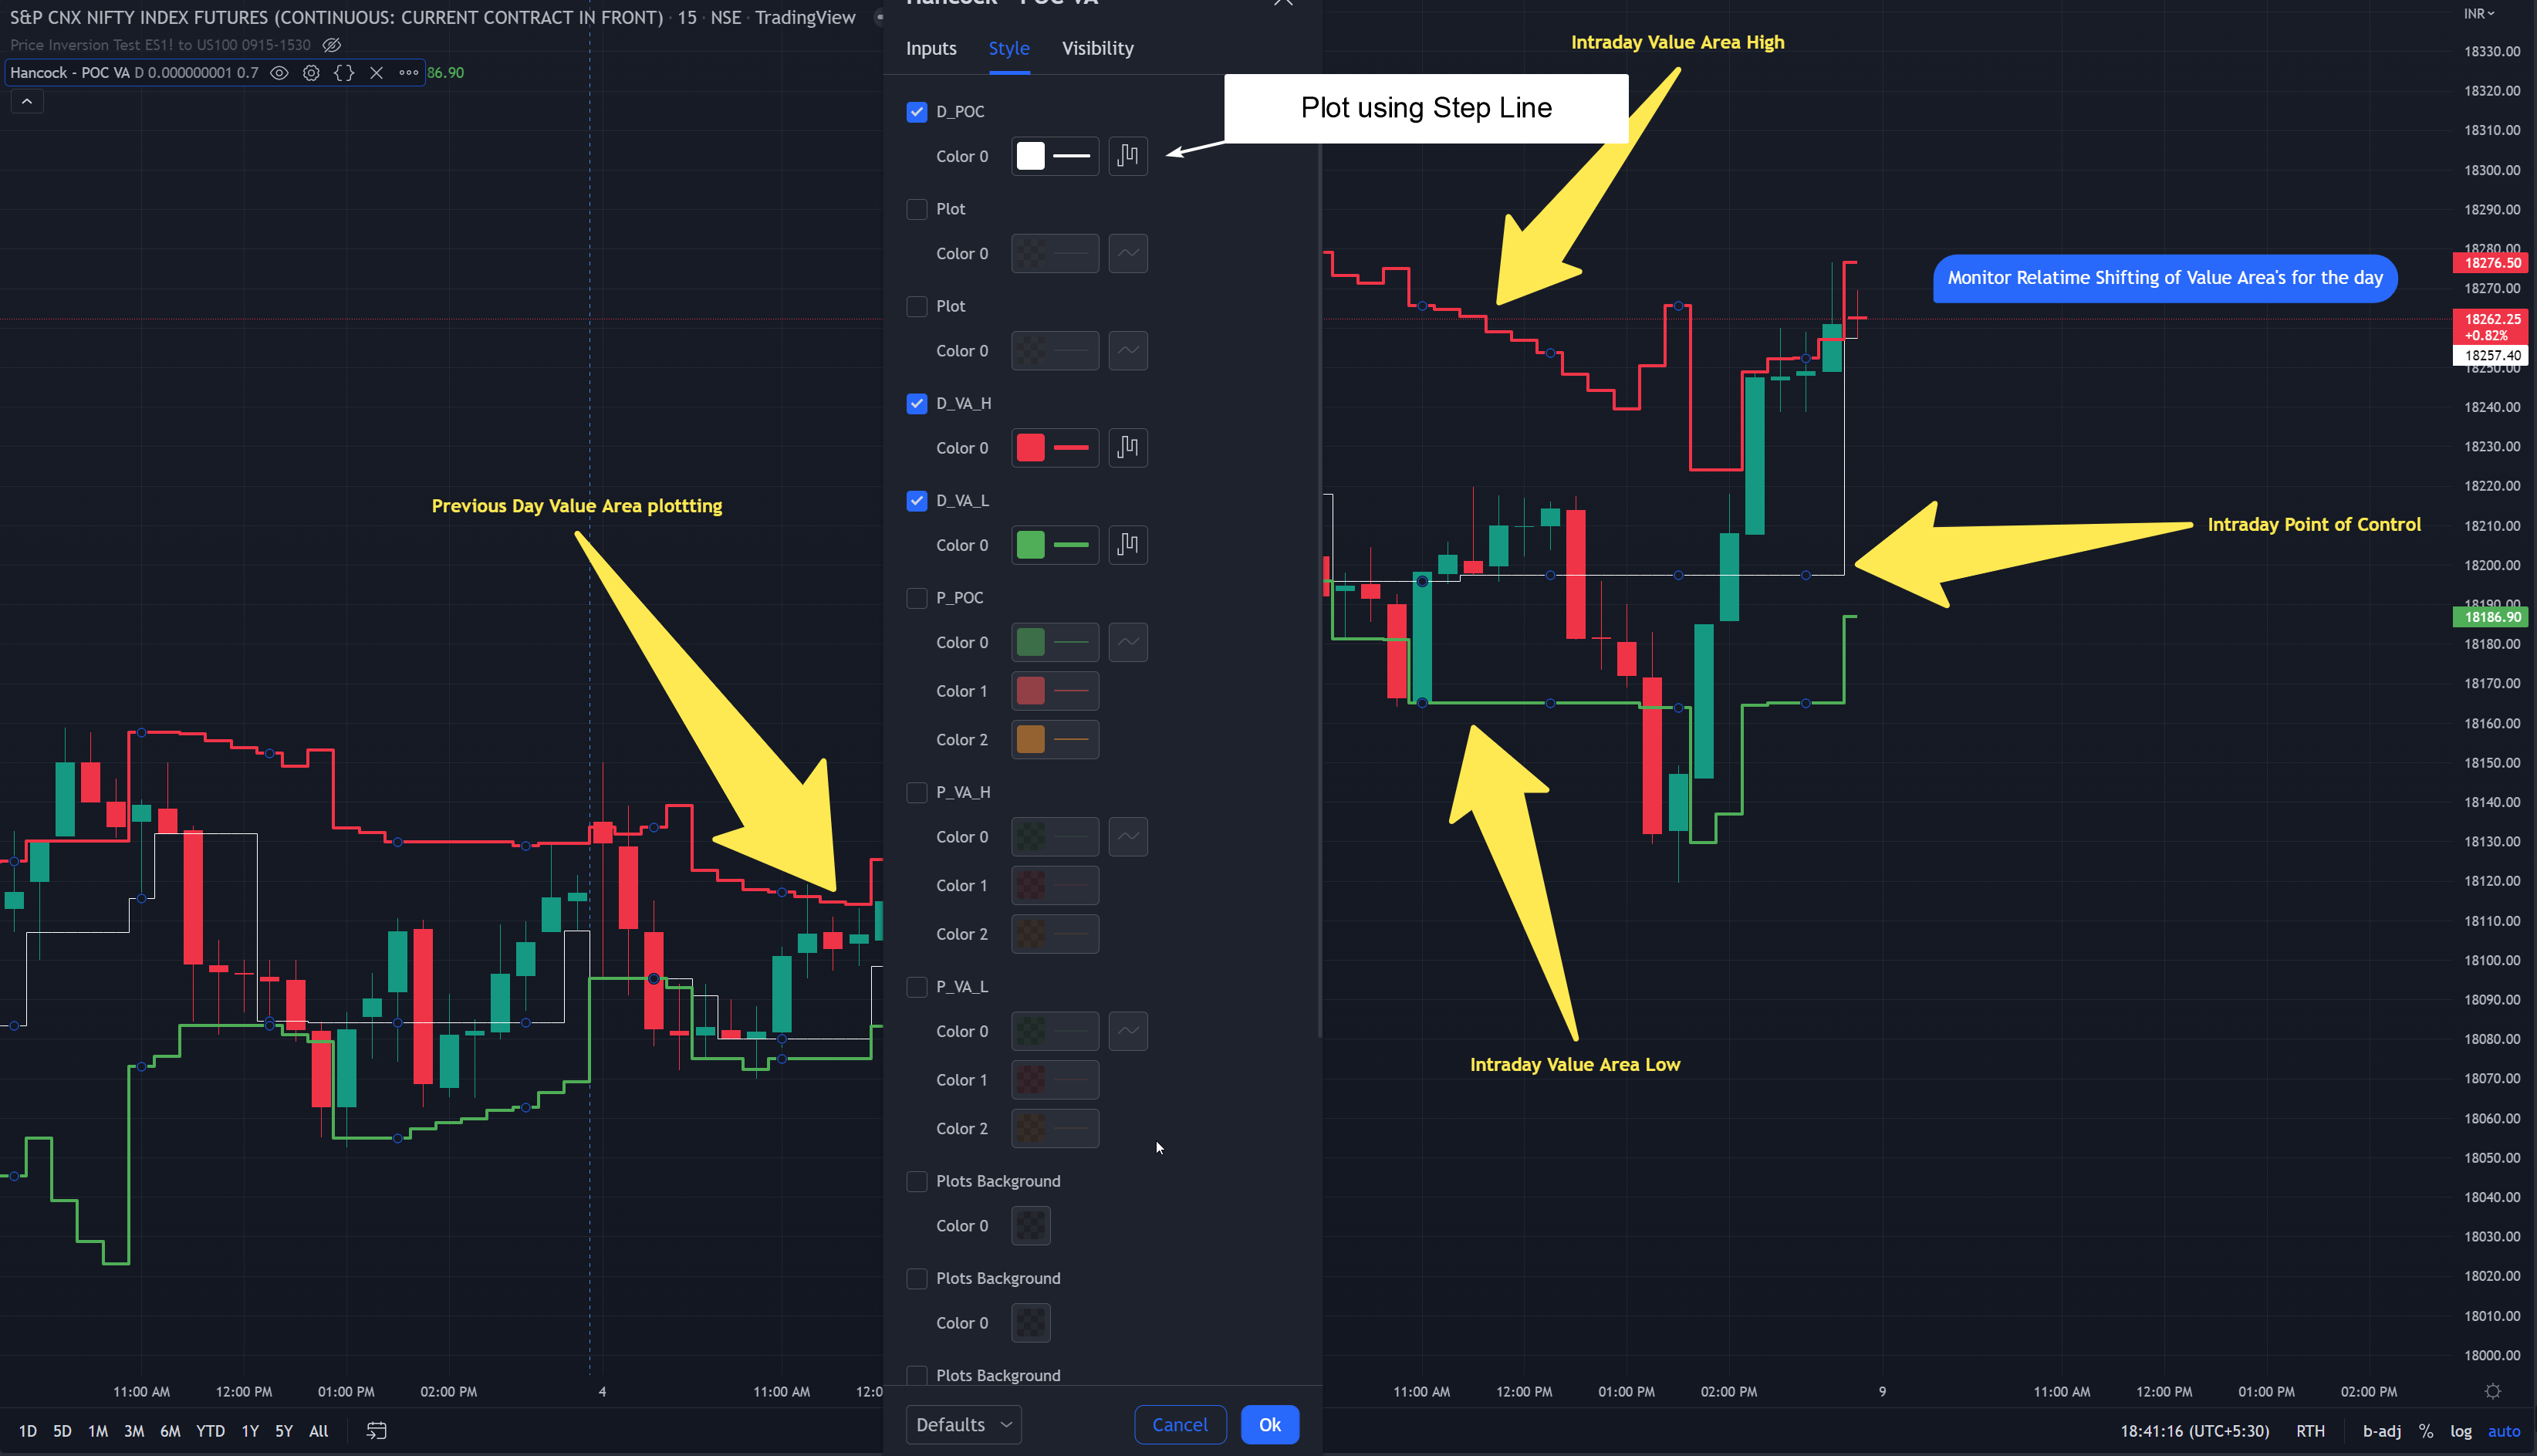
On the below image you will find the Custom settings used on the Hancock – POC VA indicator to remove the default background coloring and make it nicer for viewing..
https://in.tradingview.com/script/xGRsUBqr-Hancock-POC-VA/
Thanks to the developer for taking time to code this wonderful indicator !
Several thousand dollars worth of value provided free of cost to the Trading Community.